
 EN
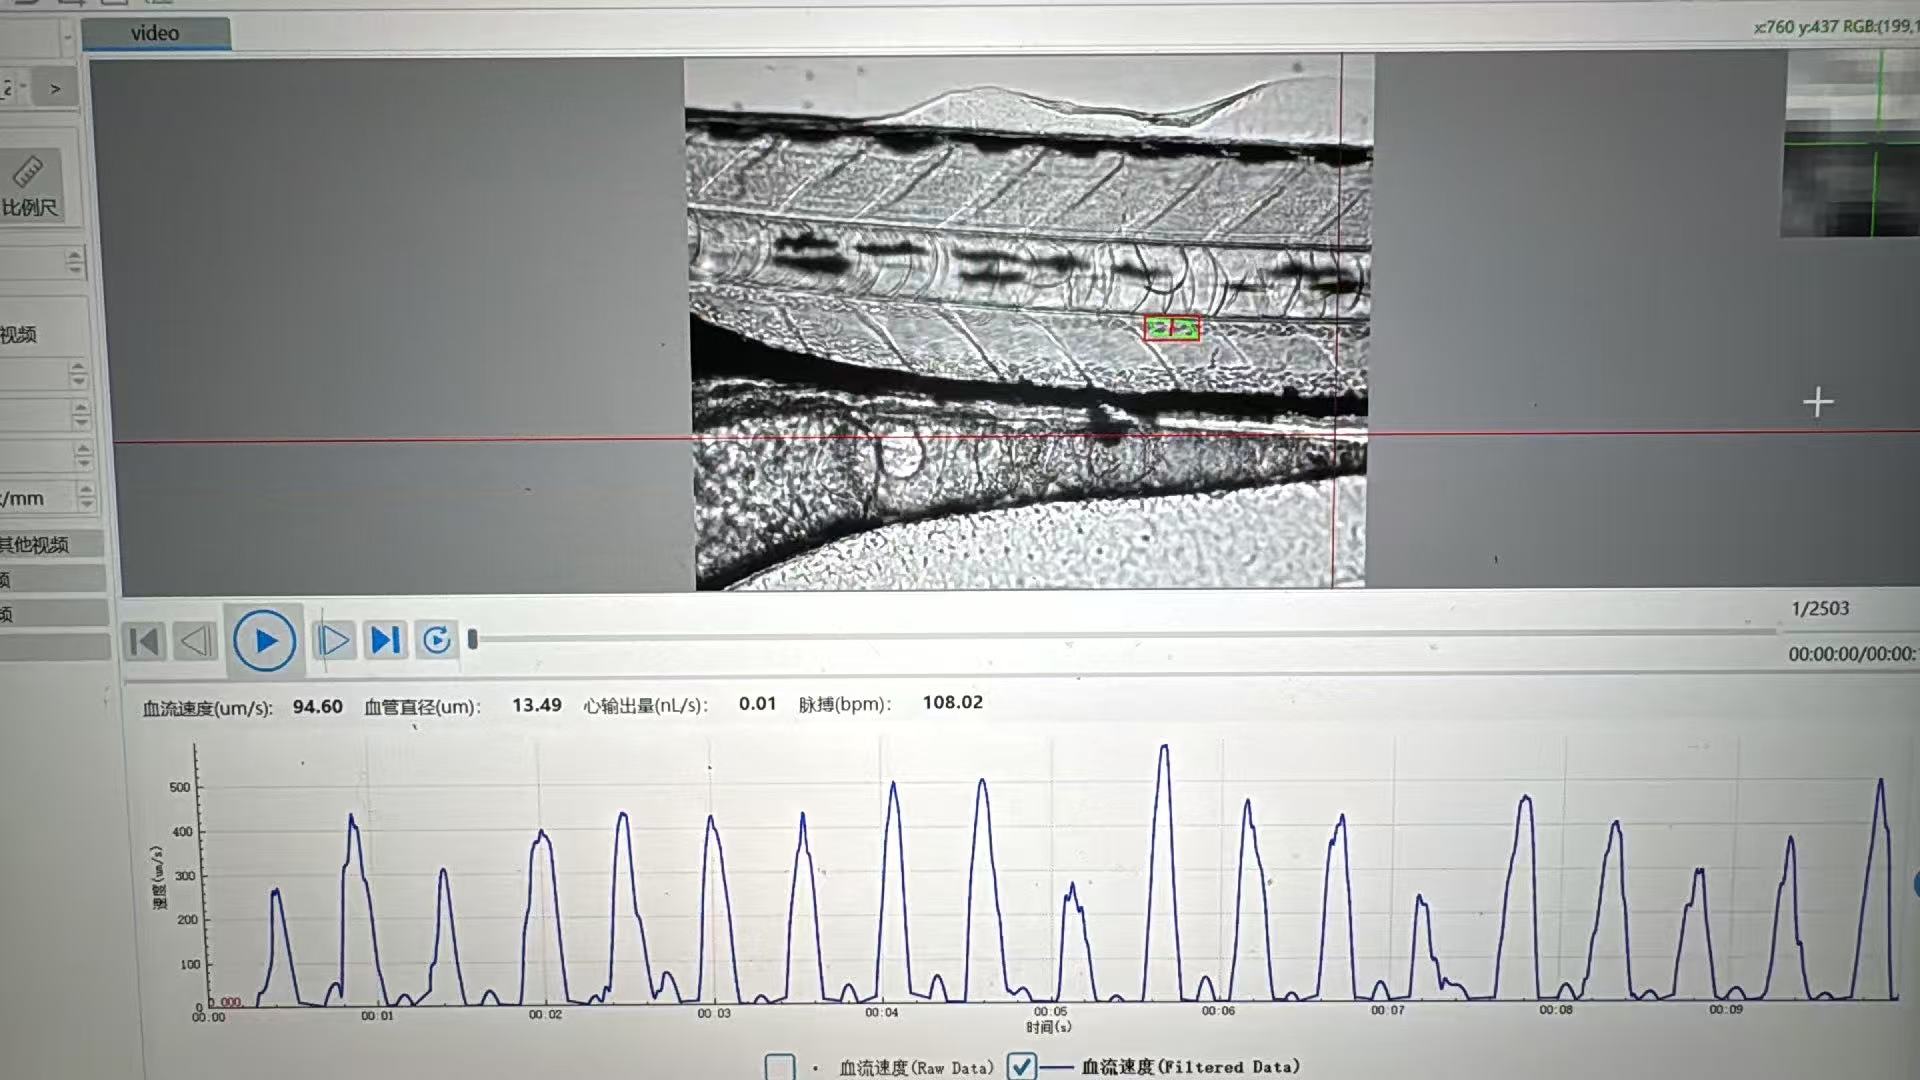
Why is a zebrafish cardiovascular analysis system with automated beat detection faster for screening?
When a zebrafish screen grows from a handful of larvae to plates of samples, the limiting step is often not imaging. It is turning moving-heart footage into a consistent decision. A Zebrafish Cardiovascular Analysis System with automated beat detection shortens that gap by converting a repeatable visual signal into a repeatable measurement pathway. Instead of asking an operator to locate the heart, count or estimate beats, record a value, and decide whether a trace is usable for every animal, the workflow standardizes those handoffs.
That does not mean automation makes every experiment instantly faster. Plate layout, developmental stage, temperature, image quality, and review rules still matter. But when those inputs are controlled, automated detection removes several small delays and sources of inconsistency that compound across a screening run.
Why manual beat review becomes the screening bottleneck
Manual review looks manageable at low sample counts. An analyst opens a clip, finds a clear cardiac cycle, counts beats over a fixed interval or watches a trace, enters a value, and then moves to the next larva. The time per sample may be modest, yet the process is serial. It also asks the analyst to make the same judgment hundreds or thousands of times.
For a cardiovascular screen, that creates four friction points:
- Heart localization: the reviewer must find a usable region in each image or video.
- Cycle identification: motion, orientation, and uneven contrast can make beats harder to distinguish.
- Transcription and traceability: observations need to become structured data that can be checked later.
- Re-review: borderline clips, disagreements, and missed metadata force the team back into the queue.
The issue is not simply labor cost. With manual counting, a difference in operator threshold can be larger than the biological shift that a borderline compound produces. That is why efficiency and data quality are linked rather than competing goals.
What automated detection changes in a Zebrafish Cardiovascular Analysis System
Automated detection uses a defined image region and a repeatable signal-extraction rule to identify periodic cardiac motion. The system can then calculate heart rate and flag a result for review according to pre-set quality criteria. The analyst changes roles: from measuring every sample to configuring the assay, monitoring exceptions, and confirming only the records that need judgment.
That redesign is faster for three practical reasons.
1. It converts repetitive work into batch processing
Once imaging settings and the analysis region are standardized, the same detection logic can run across a batch. Automated detection does not need a person to restart the counting routine for every larva. The result is a more continuous workflow from capture to data table, with fewer pauses between samples.
A published rapid workflow for medaka and zebrafish embryos paired automated imaging with software that extracted heart rate and rhythm. The relevant lesson is not that one published setup defines a universal benchmark; it is that image acquisition and beat quantification can be connected into a single workflow rather than treated as separate manual tasks.
2. It creates a review-by-exception workflow
In a well-designed Zebrafish Cardiovascular Analysis System, the system processes routine recordings first and sends low-confidence or failed records to a review list. That changes the denominator for human attention. Rather than inspecting every normal trace at equal depth, a trained user can focus on poor focus, motion artifacts, irregular rhythms, plate-edge effects, or samples outside the expected range.
This is where screening speed becomes operationally meaningful. A study result describing automated heart-region screening in zebrafish larvae reported a 75% success rate without manual handling in that specific setup. The figure should not be used as a promise for another laboratory; it does illustrate why automatic localization can reduce manual touches when sample presentation and imaging conditions are suitable.
3. It makes the decision rule consistent across the run
Automation applies the same detection settings to the same class of input. That consistency supports efficient downstream comparison because teams spend less time reconciling how different analysts arrived at a number. If a threshold or quality flag needs to change, it can be documented and applied systematically rather than reconstructed from individual notes.
Where the time savings actually come from
Screening speed is not just “fewer seconds per heartbeat.” It comes from reducing queue time throughout the workflow:
- Set up a repeatable acquisition protocol. Use consistent developmental windows, temperature control, plate orientation, exposure, and magnification.
- Acquire images or videos in an organized plate sequence. Reliable file and well identifiers prevent time-consuming reconciliation later.
- Run automated detection in batches. The system turns suitable recordings into candidate values without per-sample counting.
- Apply quality flags. Define which records can pass automatically and which need visual confirmation.
- Review exceptions and export structured results. Human expertise stays focused on uncertainty, not routine repetition.
In practice, the largest gain may appear at the end of a long day. A manual process leaves a growing backlog of videos to score. An automated workflow can return a first-pass dataset soon after capture, allowing the team to identify plate problems or unexpected effects while the experimental context is still fresh.
Efficiency depends on assay discipline, not software alone
Automated beat detection is most useful when it has stable inputs. Temperature is a good example: heart rate is sensitive to environmental conditions, so a system can calculate a value consistently while the biology still changes with the room or water conditions. Record those conditions and establish a laboratory baseline before comparing treatments.
The same caution applies to frame rate, illumination, fish orientation, anesthesia or immobilization approach, and developmental stage. If those vary unpredictably, a faster workflow may simply produce inconsistent results faster. A practical implementation plan should therefore include positive and negative controls, a small set of manually reviewed reference recordings, and clear rules for when automated output is accepted or escalated.
How to evaluate automated detection for your screening workflow
When comparing a Zebrafish Cardiovascular Analysis System, start with the workflow rather than a headline throughput claim. Ask the following questions:
- Can the system preserve plate and well identity from image capture through export?
- How does it identify the cardiac region, and what happens when confidence is low?
- Can users document detection settings, quality flags, and excluded samples?
- Which metrics are available beyond heart rate, such as rhythm or contractility-related measures?
- How easily can a reviewer revisit the original image or trace behind a reported value?
- Can the laboratory validate automated output against a representative manually reviewed subset?
These questions protect the value of automation. The goal is not to eliminate expertise; it is to allocate expertise where it improves the experiment most.
The bottom line
A Zebrafish Cardiovascular Analysis System with automated beat detection is faster for screening because it replaces serial, repetitive counting with batch analysis and exception-focused review. It can reduce time spent locating hearts, counting cycles, entering data, and resolving routine operator differences. When paired with stable imaging conditions and documented quality controls, the workflow delivers something more useful than raw speed: earlier, more consistent data for deciding what to screen next.








