
 EN
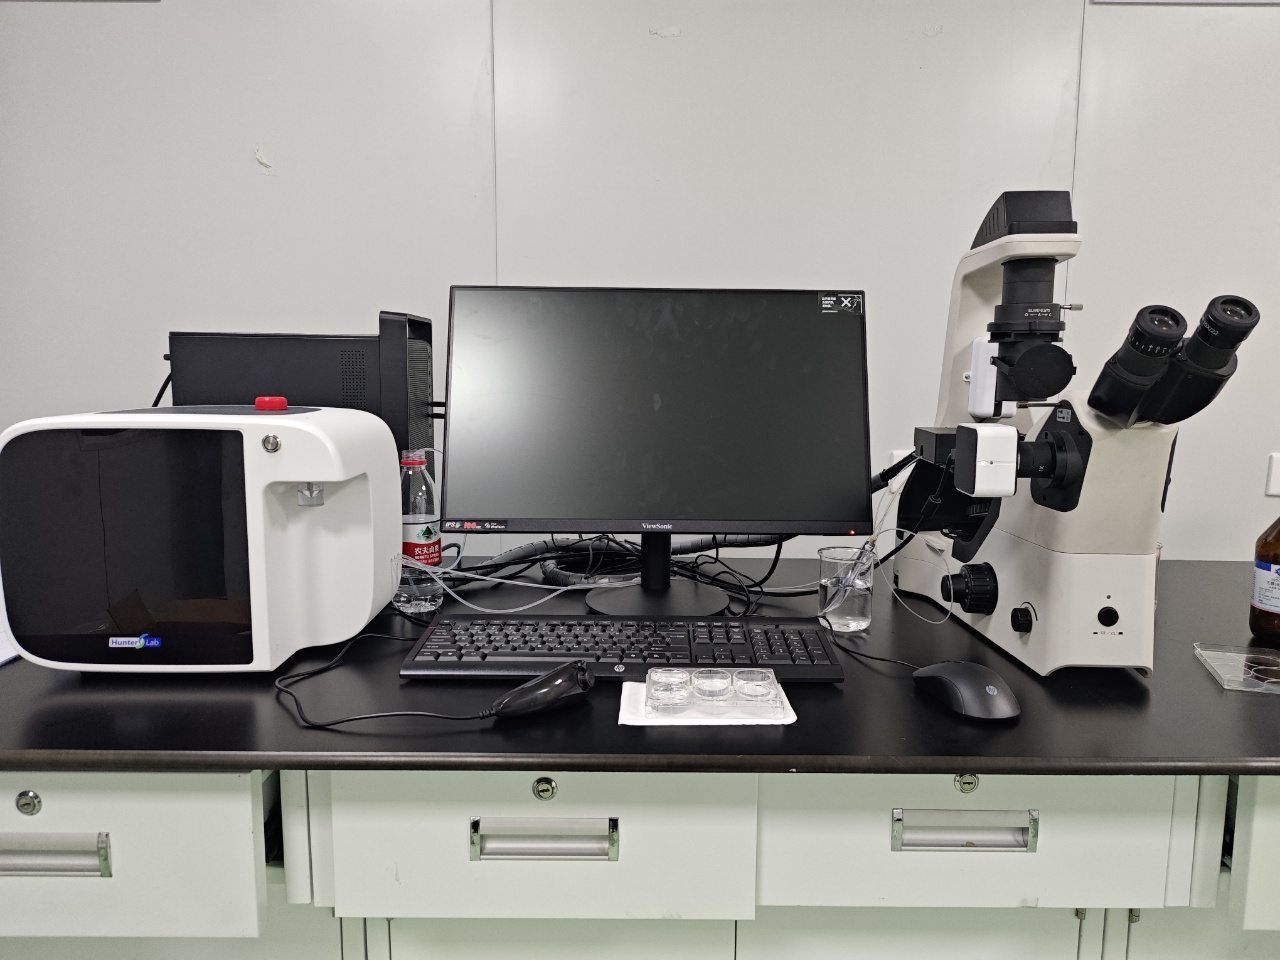
What Software Powers a Zebrafish Behavioral Analysis System?
A zebrafish behavior assay is only as useful as the chain that turns video into defensible measurements. Cameras, illumination, plates, and chambers create the experiment; software determines whether the resulting observations become consistent trajectories, interpretable endpoints, and records that another scientist can inspect. A capable Zebrafish Behavioral Analysis System therefore needs more than a screen showing fish movement. It needs acquisition controls, tracking algorithms, assay-aware calculations, quality checks, and practical data export.
For a lab starting a locomotion, photomotor, preference, or response-to-stimulus workflow, a more useful question than “Which program has the most features?” is “Which software can represent our protocol without hiding the decisions that affect the result?” That distinction matters when a study moves from a pilot run to repeated plates and downstream statistics.
The software layers inside a Zebrafish Behavioral Analysis System
Most systems combine several connected functions. They may appear in one application or in separate modules, but the workflow is broadly the same: configure the run, capture video, identify each subject, calculate endpoints, review exceptions, and export the dataset.
- Experiment setup: defines wells or arenas, timing blocks, light or stimulus events, subject counts, and naming conventions.
- Video acquisition: manages camera settings, frame rate, resolution, synchronization, and file handling.
- Tracking algorithms: convert image frames into positions, paths, movement states, or zone occupancy.
- Analysis and visualization: calculates metrics such as distance traveled, velocity, time in zone, activity bouts, or response changes over time.
- Review and data export: flags questionable tracks and produces files suitable for statistics, visualization, or archiving.
The exact mix should follow the assay. A simple single-larva locomotion assay may prioritize reliable centroid tracking and fast plate-level review. Social preference, shoaling, or adult free-swimming studies can need arena definitions, identity continuity, and more careful handling of occlusion. Three-dimensional tracking can also be relevant when depth changes are part of the biological question, but it adds calibration and validation work that a routine 2D assay may not need.
Tracking algorithms: what the software is actually deciding
Tracking algorithms are not a black box; they make a sequence of decisions about what counts as the fish, where it is, and whether a change in pixels represents motion. In a practical Zebrafish Behavioral Analysis System, common approaches include background subtraction, contrast-based segmentation, centroid tracking, contour or body-shape detection, and identity assignment for multiple fish. More advanced software may add pose estimation or machine-learning classification for specific behavioral states.
For many larval plate assays, a stable background, even illumination, and an appropriately defined region of interest make basic tracking dependable. The software should let the operator inspect the boundary or trace it generated rather than simply accepting a final number. If the system reports high activity because reflection, debris, or a moving shadow was tracked, the apparent precision is misleading.
A useful evaluation exercise is to run a small set of representative videos through the proposed software: quiet control larvae, active larvae, a plate with glare, and a run with a deliberately imperfect well. Check whether the track follows the animal, whether missed frames are visible, and whether exclusions are recorded. In my experience, a short validation set reveals workflow limitations faster than a feature checklist.
Choose endpoints before choosing the interface
Software should support the measurements your protocol can justify. Typical endpoints include total distance, mean or peak velocity, cumulative movement, inactivity time, transitions between zones, thigmotaxis-related zone occupancy, and stimulus-linked response windows. A good interface lets the user define time bins and zones in a way that maps clearly to the experimental plan.
It is also important to separate a raw measurement from an interpreted phenotype. For example, reduced distance traveled may reflect sedation, impaired locomotion, altered arousal, a technical artifact, or an unsuitable observation window. The software can calculate distance; the study design and review process determine what that change means. This is why event timelines, plate maps, treatment labels, and exclusion notes should remain connected to the exported measurements.
Data export is a scientific requirement, not an afterthought
Data export determines whether results can move cleanly into a spreadsheet, statistical environment, laboratory information workflow, or custom analysis script. At minimum, ask whether the software can export a tidy table in a broadly usable format such as CSV, plus a clearly labeled summary report. Each row should be traceable to a fish, well, arena, or recording segment, depending on the assay design.
Useful export fields commonly include the experiment ID, date and time, plate or chamber identifier, subject identifier, treatment group, time bin, endpoint name, value, units, and any quality-control or exclusion flag. Exporting only a polished graph makes it hard to audit an outlier later. Exporting raw or time-resolved trajectories alongside summaries is even better when the study may need reanalysis.
Before purchase, request a sample data export from a realistic multi-well run. Open it in the tool your team actually uses. Confirm that decimal conventions, headers, missing values, time units, and group labels survive the handoff. A file that looks complete in the vendor interface can still require hours of manual cleanup if identifiers are not stable.
Quality control features that protect the dataset
Reliable software makes problems visible. Look for replay with track overlays, detection-confidence cues where available, a way to flag or exclude wells with a reason, and an audit trail for changed settings. Batch processing can save time, but it should not turn a lighting issue across an entire plate into a silent data problem.
A common mistake is to blame the system when a result looks noisy. In practice, the mismatch may be upstream: inconsistent acclimation, an unsuitable camera angle, poorly defined wells, or a stimulus schedule that does not align with the analysis window. Software cannot repair a protocol mismatch, but it can help reveal one when its review tools keep setup details and video evidence accessible.
A practical selection checklist
- Write down the assay, life stage, number of subjects, arena format, and primary endpoints.
- Test tracking algorithms on representative videos, including difficult but realistic conditions.
- Verify that the software exposes regions, time windows, exclusions, and processing settings for review.
- Check whether summaries and time-resolved measurements can be exported in usable formats.
- Confirm that metadata and quality flags travel with the measurements.
- Plan a short validation run before committing a large study to the workflow.
Conclusion
The software behind a Zebrafish Behavioral Analysis System is the bridge between observation and evidence. The right platform does not merely automate tracking algorithms; it makes the analysis choices visible, matches metrics to the assay, and supports clean data export for the next stage of research. When you evaluate software through a real pilot dataset rather than a feature list, you are more likely to build a workflow that is efficient, reviewable, and ready for reproducible behavioral studies.








