
 EN
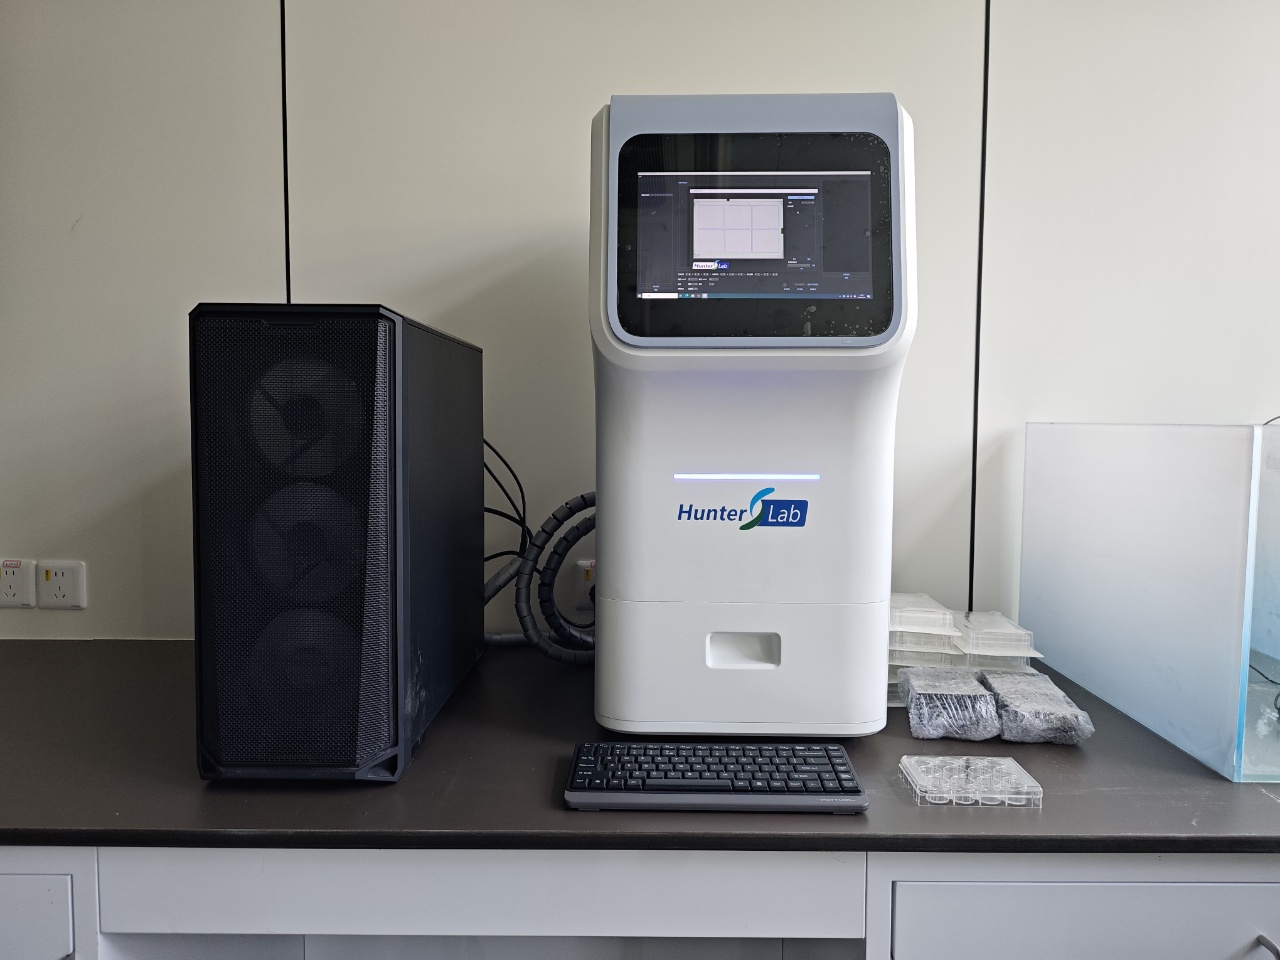
What are the data analysis challenges in zebrafish larva behavior analysis?
A Zebrafish Larva Behavior Analysis System can turn video into movement metrics quickly, but speed is not the same as dependable interpretation. In day-to-day larval work, the hard part is rarely exporting a spreadsheet. It is deciding whether a difference in distance moved, activity bouts, turning, or response to a light change reflects biology, a handling difference, or a tracking artifact. This article explains the analysis problems that deserve attention before a result reaches a graph or a decision.
Larval assays such as basal locomotor activity and visual motor response are widely used because they make behavior observable at scale. Yet the same convenience can hide variation. A well-configured Zebrafish Larva Behavior Analysis System should preserve the experimental context alongside the measurements, rather than treating every number as directly comparable.
Why behavior data become difficult to interpret
Behavior is a time series, not a single endpoint. A larva may be still during acclimation, active immediately after a light transition, and inactive later for a different reason. If the analysis window is too broad, a short response can disappear into an average. If it is too narrow, incidental motion can look like an effect. The first challenge in Zebrafish Larva Behavior Analysis System workflows is therefore defining which time segments answer the biological question.
Age, time of day, plate position, illumination sequence, temperature, and prior handling can all shift the baseline. That does not mean a study is unusable; it means the data analysis plan needs those variables recorded before grouping samples. Conditional qualification matters here: a threshold that works for one strain, developmental stage, camera view, and water-temperature range may not work under another set of conditions.
Challenge 1: turning video into trustworthy tracks
Tracking software estimates where each larva is in each frame. Low contrast, reflections, debris, bubbles, shadows, and overlapping silhouettes can cause a track to jump, fragment, or switch identity. Fine behaviors can be even more demanding because eye and tail kinematics require appropriate spatial detail, not just a visible body outline. A Zebrafish Larva Behavior Analysis System should make it possible to inspect the original clip beside the derived path for a sample of wells.
Do not rely only on a global tracking-success percentage. Review failures by treatment group, row, lighting phase, and recording batch. A small error rate that clusters in one condition may bias the conclusion more than a larger, random error rate. In practical Zebrafish Larva Behavior Analysis System use, a simple exclusion log is often more valuable than silently deleting suspicious rows.
Challenge 2: definitions that change the result
“Active,” “immobile,” “burst,” and “turn” sound intuitive, but each requires an operational definition. A movement threshold set near camera noise can inflate activity; one set too high can erase slow swimming. The same issue applies to smoothing, minimum-bout duration, zone boundaries, and how missing frames are handled. These choices are part of the experiment, not merely software settings.
For a Zebrafish Larva Behavior Analysis System, write a short metric dictionary before inspecting group outcomes. Include the unit, sampling interval, threshold, filtering rule, and reason for exclusion. This reduces the temptation to adjust parameters after seeing a favored result. It also makes later data analysis easier to audit and repeat.
Challenge 3: batch effects and hidden confounders
A plate recorded on Monday may not be directly comparable with a plate recorded on Thursday. Camera focus, illumination, room activity, operator timing, and incubation conditions can introduce batch effects. In a multi-week screen, the signal caused by batch can be comparable to or larger than a modest compound effect. That is why a Zebrafish Larva Behavior Analysis System should capture metadata, plate maps, acquisition settings, and calibration notes with the behavioral output.
Randomize treatments across plates where feasible, include appropriate controls in each run, and visualize controls by date before pooling datasets. When the literature and the bench disagree, investigate the setup rather than forcing the data to match expectation. For example, a published assay window may need local validation if the lighting hardware or developmental timing differs.
Challenge 4: high-dimensional output and multiple comparisons
Modern Zebrafish Larva Behavior Analysis System workflows can produce distance, velocity, acceleration, angular change, time in zone, inactivity, and transition-specific responses for every individual. This richness is useful, but it creates a multiple-comparison problem. Searching dozens of metrics and windows will eventually uncover apparently significant differences by chance.
Choose a primary endpoint before analysis, treat secondary measures as supporting evidence, and report how many comparisons were considered. When several variables describe the same behavioral pattern, summarize their relationship instead of presenting every p-value as an independent discovery. Clear visualization of individual trajectories and plate-level distributions can reveal whether an average is supported by consistent observations.
Challenge 5: automation still needs validation
Automation reduces repetitive work and can improve consistency, especially in larger screens. But an automated call is not self-validating. Compare a defined sample of automated labels with a blinded manual review, retain versioned analysis settings, and rerun a small reference dataset after a workflow update. In a Zebrafish Larva Behavior Analysis System, traceability is the bridge between automation and confidence.
We started out thinking more metrics automatically meant better insight, but the more reliable interpretation often comes from a smaller, pre-specified set supported by clean video, stable acquisition conditions, and transparent rules. Actually, that last point is easy to underestimate: a sophisticated dashboard cannot repair an ambiguous definition of behavior.
A practical quality-control sequence
- Define the behavioral question, primary endpoint, time windows, and exclusion criteria before recording.
- Lock camera, lighting, temperature, plate layout, and acclimation settings as far as the protocol allows.
- Use the Zebrafish Larva Behavior Analysis System to retain raw-video references, metadata, and versioned software parameters.
- Audit representative tracks across treatments and batches before calculating group statistics.
- Plot controls by run, inspect distributions and missingness, then document any justified exclusions.
- Interpret challenges as information about assay limits, not as a reason to hide variability.
What good analysis looks like
A useful Zebrafish Larva Behavior Analysis System does more than report movement. It helps a lab connect raw recordings to reproducible, explainable decisions. The strongest workflow is not the one with the most automated outputs; it is the one where another researcher can understand the acquisition context, recreate the rules, audit the tracks, and see why the conclusion follows from the data.
When planning your next experiment, prioritize controlled acquisition, a pre-defined metric dictionary, transparent quality checks, and proportionate statistics. Those habits make data analysis more credible and turn recurring challenges into manageable parts of a reliable behavioral workflow.








