
 EN
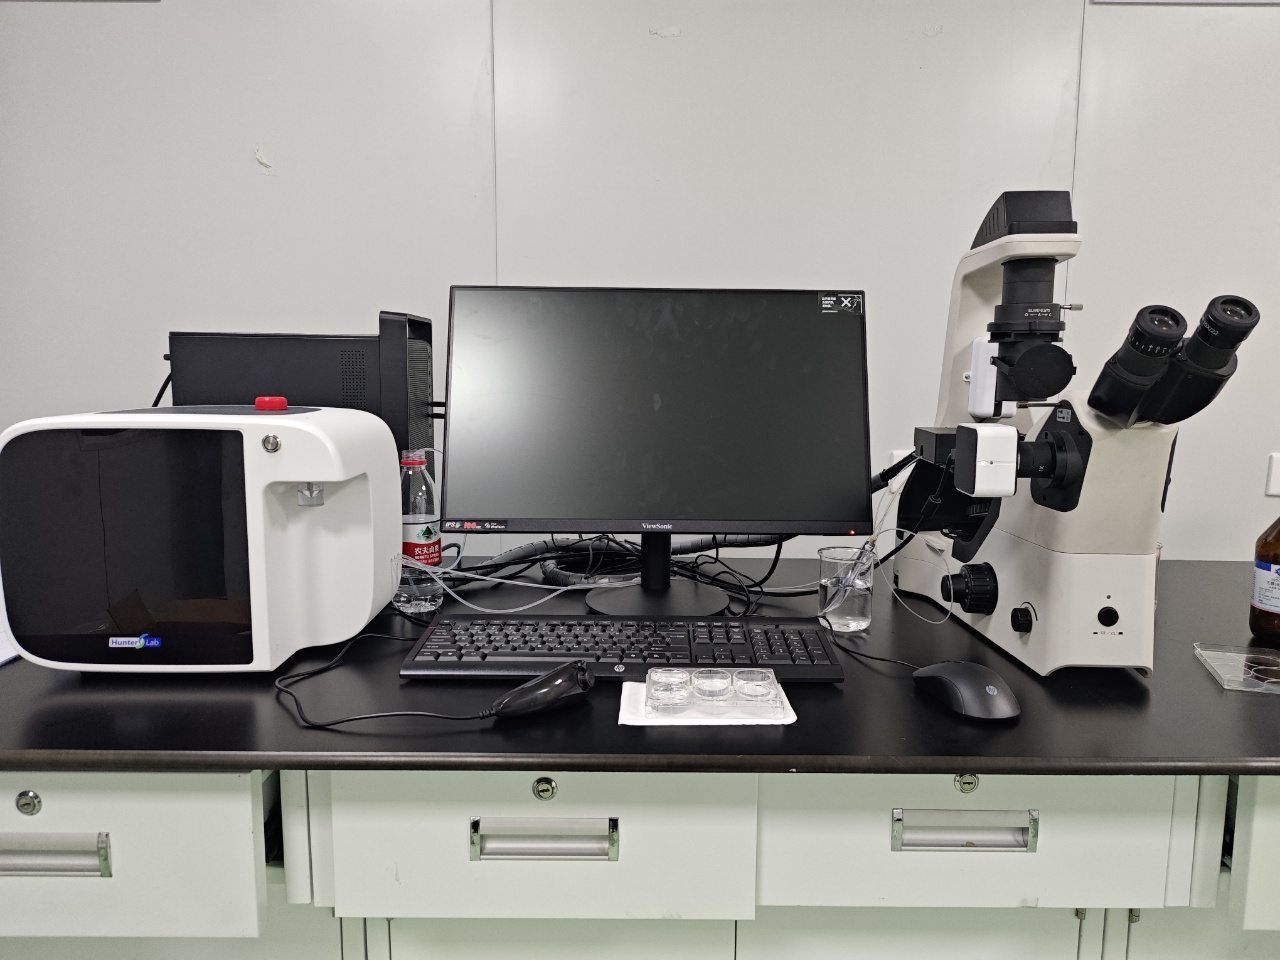
What the System Sees When a 96-Well Plate Enters the Workflow
A zebrafish larva behavior analysis system turns a 96-well plate from a compact housing format into a repeatable behavioral assay. Rather than treating the plate as 96 independent videos, the system identifies the plate layout, assigns one tracking region to each well, measures each larva over time, and exports comparable per-well endpoints. That workflow makes high-throughput screening practical without losing sight of the biological and technical controls that determine whether the result is meaningful.
In a typical plate assay, one larva is placed in each assigned well with the planned treatment and control pattern. The system first needs a stable view of the entire plate. Plate detection or a saved template establishes the well grid, and each region of interest is tied to a well ID. That mapping is essential because a trajectory only becomes useful when it remains connected to the treatment map, concentration, replicate, and time block.
During tracking, the system separates the moving larva from the background inside each well and follows its position frame by frame. Depending on configuration, it can derive distance moved, velocity, time active, immobility, turning related measures, zone occupancy, or response during a programmed stimulus phase. The exact endpoint should follow the protocol. A locomotor assay built around light to dark transitions, for example, should preserve the timing of those transitions instead of averaging the entire recording into one unqualified value.
How the System Creates Reliable Per-Well Data
Plate registration and assay map import come first. The system uses plate geometry to keep well A1 distinct from H12 throughout the session. Verify the orientation mark, plate type, and well boundaries before starting. A mirrored plate map or a shifted grid can turn a technically successful video into a biologically unusable comparison.
Baseline, acclimation, and stimulus timing come next. Behavior is time dependent. A defined acclimation period before the acquisition window helps separate handling effects from treatment related behavior. If the protocol uses light dark cycles, vibration, or another challenge, the system should store those event times with the tracking output.
Per-well trajectory extraction follows. For each valid well, tracking produces a coordinate sequence over time. From that sequence, the system calculates endpoints using the same rules for every replicate. The distance threshold, smoothing, sampling interval, and definition of inactivity should not change halfway through a treatment set. When a parameter changes, it belongs in the assay record.
Quality control flags come before group statistics. A high throughput workflow needs an exclusion trail. Empty wells, multiple larvae, severe glare, bubbles, debris, blocked views, and escapees can distort an activity result. The system should make those cases reviewable at the well level, ideally with the associated clip or tracking overlay. Keep the reason, the well ID, and the count of retained replicates in the report.
| Workflow Stage | What Gets Standardized | Why It Matters |
|---|---|---|
| Plate registration | Well grid, orientation, plate type | Prevents mirrored or shifted maps |
| Acclimation timing | Baseline window, stimulus events | Separates handling from treatment effects |
| Trajectory extraction | Distance thresholds, smoothing, sampling | Ensures consistent rules across wells |
| Quality control | Exclusion flags, reviewable overlays | Protects group statistics from artifacts |
| Export | Well ID, timestamp, plate map, endpoint | Keeps results traceable and auditable |
Why the 96-Well Format Needs Careful Experimental Design
The throughput advantage of a 96-well plate is real, yet it increases the importance of layout discipline. Do not group all controls at one end and all concentrations at the other when a plate position effect is plausible. Distribute controls, randomize or balance treatments where the protocol allows, and keep biological replicates distinct from technical repeats. A system can report a clean plate map, but it cannot repair confounding introduced during dispensing.
Environmental consistency matters as much as the tracker. Larval movement can change with illumination, temperature, handling, developmental stage, and observation duration. The most useful troubleshooting question is not whether the software tracked, but whether the control wells behaved as expected under the same conditions. If the answer is no, inspect the assay conditions before assigning a biological interpretation to treatment wells.
It is also worth distinguishing high throughput from high confidence. Pushing throughput as high as possible is tempting, but uneven larval loading or inconsistent acclimation can quietly undermine results until the team slows down and standardizes the setup. A system supports scale best when the protocol defines acceptable well level quality before the plate is run.
A Practical 96-Well Plate Workflow
Define the readout before loading the plate. Build the plate map with treatments, controls, replicates, and planned exclusions in a traceable layout. Standardize preparation with consistent larval age, handling, volume, acclimation, and environmental conditions. Validate the view by confirming the plate is level, all wells are visible, and tracking regions align with the physical plate.
Run the acquisition and use the system to record trajectories and flag wells requiring review. Review controls first by inspecting representative overlays and control distributions before comparing treatment groups. Export traceable results that retain well IDs, timestamps, plate map metadata, QC decisions, and endpoint definitions with the dataset. These steps keep the workflow grounded in evidence rather than assumption.
What to Look For When Evaluating a System
When selecting or configuring a system, focus on workflow fit rather than a single headline metric. Ask whether it supports the plate type in use, preserves per-well identity, allows transparent threshold settings, records stimulus timing, and makes exceptions visible for review. Also ask how raw video, overlays, plate maps, and exports are connected. The right approach depends on the assay and the question. There is no single configuration that works for every laboratory.
For 96-well work, a useful system lets the team move from many short observations to a defensible behavioral dataset. With a well defined plate map, controlled conditions, thoughtful tracking, and auditable QC, the system makes high throughput behavior studies more manageable while keeping interpretation tied to the biology. Hunter Lab supports zebrafish laboratories with larva behavior analysis and imaging equipment built for core facility workflows. The company's experience covers system integration, data handling, and the operational realities of maintaining zebrafish research programs. For facilities evaluating high throughput behavior systems, Hunter Lab offers a partner that understands how plate design, tracking rules, and daily husbandry affect reproducible behavioral data.








