
 EN
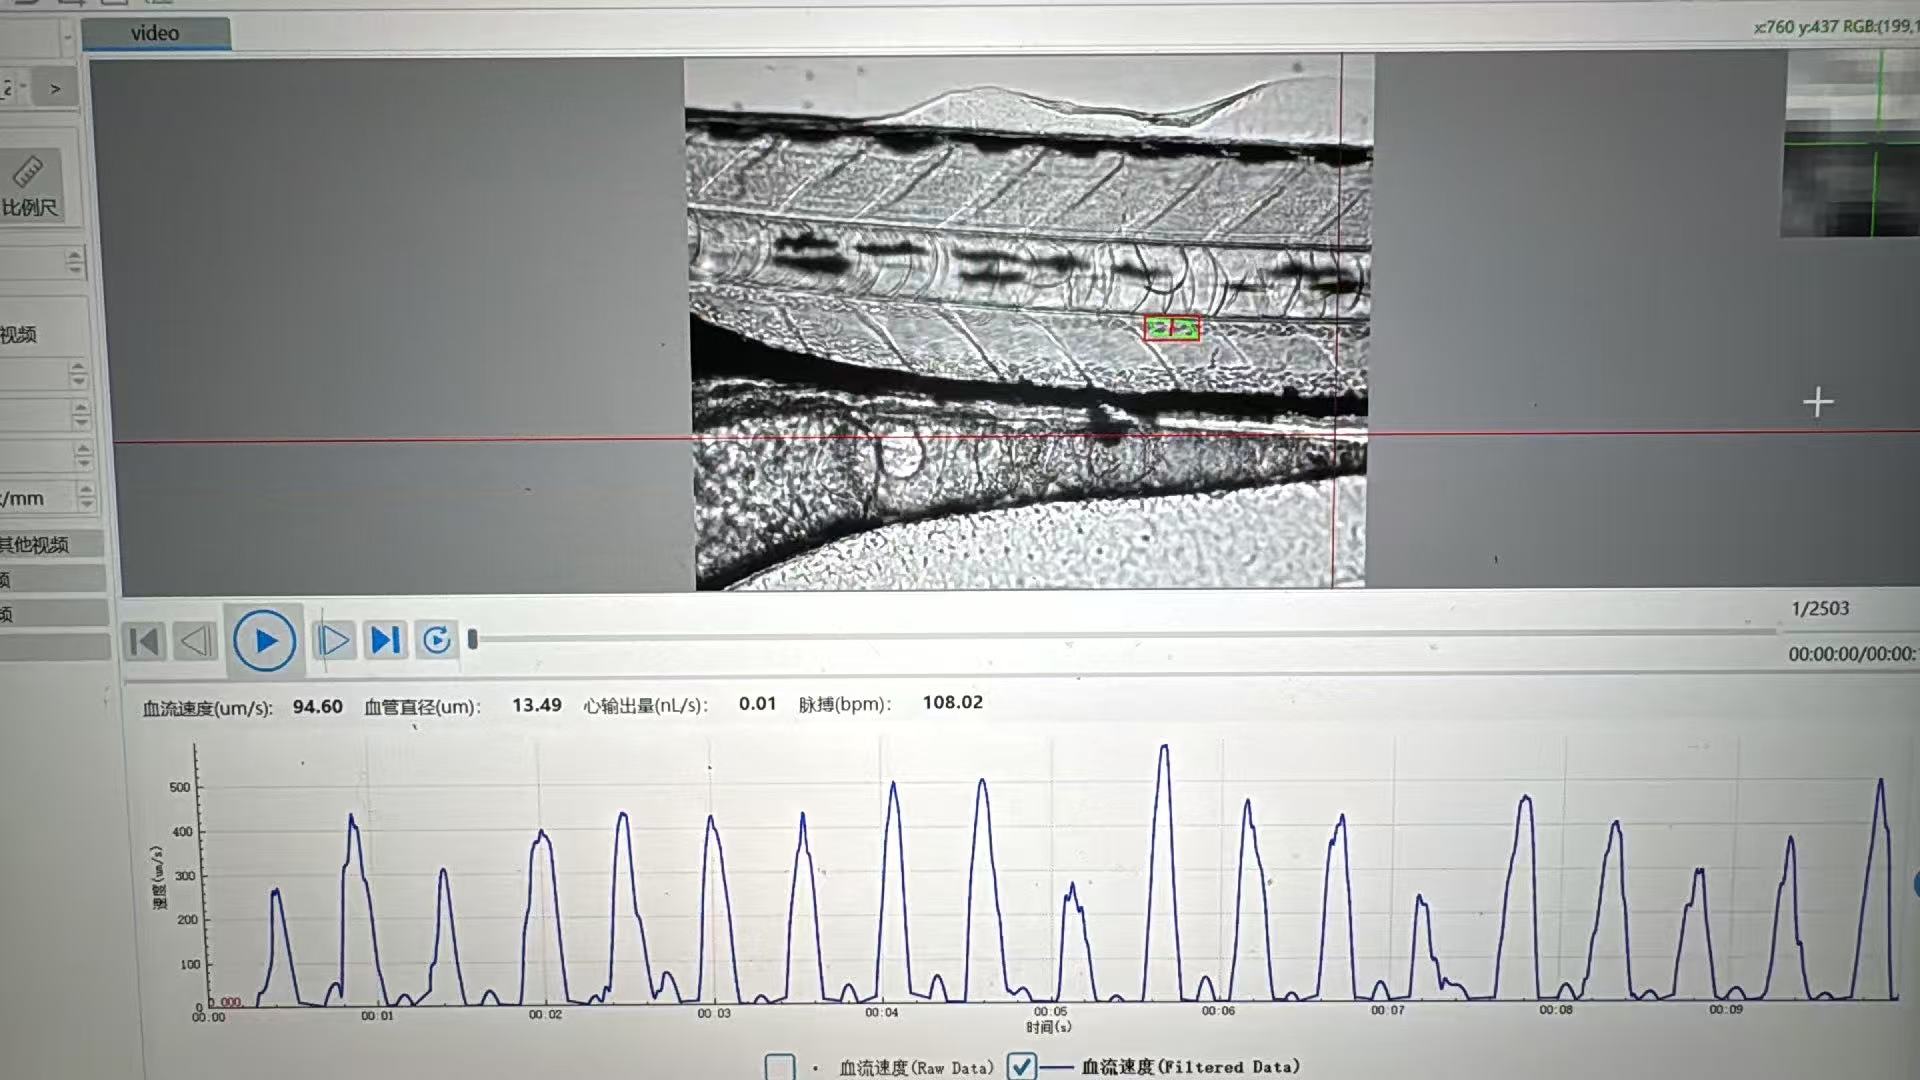
How does a zebrafish heart rate monitor support high-throughput screening?
A Zebrafish Heart Rate Monitor supports high-throughput screening when it turns short cardiac recordings into consistent, reviewable measurements across a planned plate workflow. In practice, the monitor is not just a camera pointed at a larva. It is the connection between multi-well handling, image capture, automated analysis, quality control, and the decision to advance or deprioritize a test condition.
For a pharmaceutical R&D team, a core facility, or a safety group, that distinction matters. A faster capture step alone does not create useful throughput if operators still need to locate hearts manually, re-enter plate metadata, or repair a large share of failed traces. A well-designed Zebrafish Heart Rate Monitor helps make the full loop more repeatable, so the team spends more time interpreting results and less time reconstructing what happened in each well.
Why heart rate is a practical screening endpoint
Zebrafish embryos and larvae offer an observable cardiac phenotype in a living vertebrate model. Heart rate can become an early, quantitative signal during compound, ingredient, genetic, or environmental screens, especially when it is considered alongside morphology, survival, behavior, rhythm regularity, and experimental context. It should not be treated as a stand-alone verdict on safety or efficacy; rather, it is a structured endpoint that can help a team identify conditions worth closer follow-up.
That makes high-throughput screening possible because the same basic question can be asked many times: is the cardiac rhythm in this well different from an appropriately matched control under the same imaging and developmental conditions? A Zebrafish Heart Rate Monitor makes that question operational by applying comparable acquisition and analysis steps to each sample.
From multi-well plate to analyzable cardiac data
The workflow usually begins before imaging. Each multi-well plate needs a map that links well position to sample identity, dose, replicate, developmental stage, and control status. Without that map, automation may produce many measurements but little traceability. Teams also need a consistent approach to temperature, acclimation, illumination, orientation, and any anesthesia or immobilization method, because these conditions can influence cardiac readouts.
Next comes capture. Depending on the assay design, a monitor may acquire a short video sequence at each well or use a motion-based signal from the cardiac region. The useful objective is not merely to visit wells quickly; it is to capture enough stable frames to support a reliable beat-to-beat or frequency estimate. Published zebrafish embryo screening work has reported 30–50 minutes to screen a 96-well plate, with the duration depending on the video sequence taken for each heart. That is an illustrative workflow result, not a universal throughput specification, but it shows why recording length and plate handling belong in the same planning discussion.
Then the analysis stage converts motion or image information into heart-rate values and flags records that deserve review. A monitor that retains well-level metadata and image evidence can make this step more useful: analysts can distinguish a biological shift from a poorly focused image, an empty well, an animal that moved out of view, or an uncertain region of interest.
Where automation creates real efficiency
Automation adds the most value when it reduces repeated manual tasks without hiding exceptions. In a high-throughput screening workflow, that can include automated well-to-well movement, standardized focus or capture settings, plate-map import, batch analysis, and export of results in a format that downstream statistical tools can use. The outcome is improved consistency across runs, operators, and plates—not simply a larger number on a throughput slide.
Consider the time costs in a manual workflow. An analyst may need to open each video, identify the heart, select a region, count or validate beats, and transfer the result to a spreadsheet. Even a small amount of work per sample becomes substantial across multiple plates. With appropriate automation, the analyst’s role shifts toward defining acceptance criteria, checking flagged wells, and interpreting patterns. That is a more defensible use of expert time.
Published automated heartbeat work has also shown how plate architecture changes scale: one approach captured up to six embryos per well and processed more than 500 embryos per 96-well plate. That does not mean every assay should use multiple embryos per well. Pooling changes independence, image complexity, and analysis requirements. It does show why a Zebrafish Heart Rate Monitor should be evaluated as part of the whole multi-well assay design rather than as an isolated instrument feature.
Automation still needs quality gates
Automation can introduce its own errors. A low-confidence trace may arise from motion artifact, poor focus, overlapping embryos, insufficient contrast, variable anesthesia depth, or an incorrect cardiac region. If the system produces a number for every well but provides no way to review confidence or source imagery, efficiency can become false precision.
A practical quality-control plan should define which wells are accepted, flagged, repeated, or excluded before the screen begins. Useful checks include control performance on every plate, image-quality thresholds, minimum recording duration, a rule for manual review of uncertain calls, and a documented reason for every exclusion. Laboratories should also trend baseline values over time. The normal range is not fixed: developmental timing, strain, temperature, and handling can shift it.
How to judge a monitor for screening readiness
When comparing a Zebrafish Heart Rate Monitor, ask workflow questions before relying on headline claims:
- Plate fit: Can the capture approach work with your intended multi-well format and sample layout?
- Traceability: Does each result remain connected to a plate, well, recording, and experimental metadata?
- Analysis transparency: Can users review images or traces when an automated result looks implausible?
- Exception handling: How are empty wells, motion artifacts, and low-confidence calls flagged rather than silently accepted?
- Data handoff: Can results move cleanly into the team’s statistics, visualization, and archival process?
- Validation support: Can the supplier help align the setup with the lab’s developmental stage, controls, throughput target, and cardiac endpoints?
For teams building a new cardiac screen, application-specific consultation is often more valuable than a generic feature list. Hunter Lab focuses on zebrafish instruments and cardiovascular analysis and can help teams frame the assay workflow, but each laboratory should validate its own conditions before using data for a specific research or decision-making purpose.
Turning measurements into screening decisions
The last step is often overlooked. A monitor supports screening only when the output supports a decision rule. For example, a team might rank conditions by deviation from matched controls, combine heart-rate shifts with morphology observations, and route only predefined patterns to secondary imaging or confirmation. This keeps the first-pass screen efficient while preserving enough evidence for follow-up.
In that sense, a Zebrafish Heart Rate Monitor supports high-throughput screening by creating a disciplined chain: planned multi-well setup, repeatable capture, automation that preserves reviewability, quality gates, and data that can be acted on. A useful workflow is not simply the one that produces the most values. It is one that supports trustworthy next decisions per plate.








