
 EN
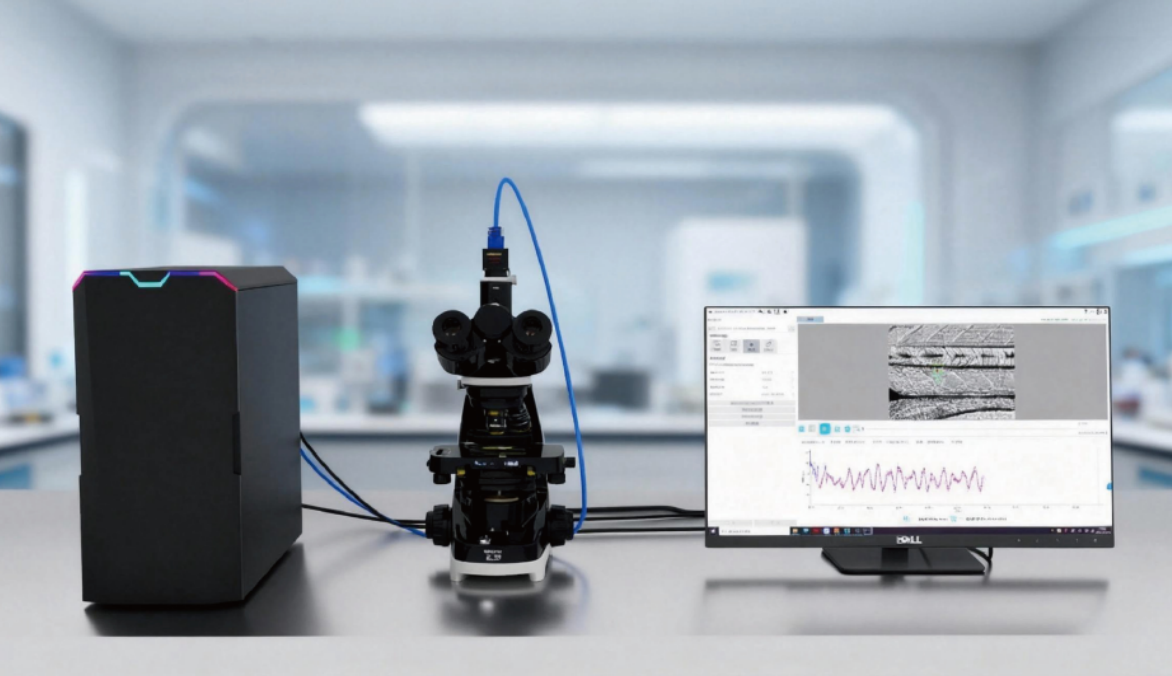
How Can a Zebrafish Blood Flow Analysis System Quantify Cardiac Output?
Cardiac output is easy to define but not necessarily easy to measure well in a small, rapidly beating zebrafish heart. In simple terms, it is the volume of blood moved by the ventricle each minute. A Zebrafish Blood Flow Analysis System turns synchronized imaging into a repeatable estimate by measuring the heart’s filling and emptying, timing the cardiac cycle, and checking whether the observed circulation is consistent with those measurements. For cardiovascular researchers, the important question is not whether a video looks normal; it is whether the measurements can support a defensible comparison between groups.
The calculation starts with a simple relationship:
Cardiac output = heart rate × stroke volume.
That equation is straightforward. The quality of the answer depends on how reliably a Zebrafish Blood Flow Analysis System identifies ventricular boundaries, captures enough frames per beat, and controls biological conditions that influence the heart.
Start with the measurement chain, not a single flow image
A high-quality recording can reveal red-cell movement, chamber contraction, and the direction of blood flow. Still, one image cannot provide cardiac output. The system needs a sequence of measurements that connects anatomy to timing. First, the operator records the beating heart at a known developmental stage and under a consistent imaging setup. Next, the analysis defines ventricular dimensions at end-diastole, when filling is greatest, and at end-systole, after contraction. The difference between those estimates is stroke volume.
In a Zebrafish Blood Flow Analysis System, this sequence is commonly supported by segmentation or carefully placed contours. Depending on the validated protocol, ventricular volume may be estimated from two-dimensional measurements using an assumed geometric model, or from a more direct three-dimensional approach. That choice has practical consequences. A geometric approximation can be useful for comparisons made under the same conditions, but it should not be presented as if it were a direct physical volume measurement.
Once stroke volume is available, the analysis counts beats over a known interval to obtain heart rate. Multiplying the two values yields cardiac output for that specimen. Repeating the calculation across larvae or adults produces a group-level comparison rather than a conclusion based on a single attractive video.
Where blood-flow measurements fit
A Zebrafish Blood Flow Analysis System can also characterize blood movement in the dorsal aorta, caudal vein, outflow tract, valves, or cardiac chambers. Velocity is valuable, but velocity alone is not cardiac output. To estimate a vessel’s volumetric flow rate, the analysis must pair velocity with a measured cross-sectional area and account for the velocity profile used by the method. This is why a headline number from particle tracking or Doppler-style analysis should be interpreted as a complementary hemodynamic readout unless the full flow calculation has been validated.
Read together, chamber-based output and vessel-based flow rate offer a more complete picture. A lower volume-derived cardiac output with lower downstream velocity may point to a coherent cardiovascular phenotype. If the two measures move in opposite directions, the discrepancy is not automatically an error. It can prompt a closer look at vascular resistance, shunting, image plane, or the assumptions used to derive volume.
A repeatable workflow for quantification
- Define the biological comparison. Fix the strain, developmental window, treatment timing, and primary endpoint before recording. A difference between 3 and 5 days post-fertilization may reflect development rather than treatment.
- Standardize preparation. Use the same orientation, mounting method, temperature, illumination, and acclimation period for every group. Anesthesia deserves special attention because its dose and exposure time can alter the heart and circulation.
- Acquire a suitable movie. The camera must sample the beating heart with enough temporal resolution to identify end-diastole and end-systole. Motion blur, an oblique plane, or clipped chamber edges weakens later quantification.
- Set measurement landmarks. In the Zebrafish Blood Flow Analysis System, apply the same ventricular boundary rule and timing rule across specimens. Save overlays or annotations so an analyst can audit what the software measured.
- Calculate stroke volume and heart rate. Review multiple consecutive beats rather than selecting the most favorable cycle. Report the aggregation rule, such as a mean of accepted beats.
- Compute and review cardiac output. Compare output alongside heart rate, stroke volume, and any relevant flow-rate metric. A change in output is more interpretable when the component that drove it is visible.
Why heart rate is not enough
Heart rate is fast to collect, so it is often the first number examined. Yet two zebrafish can have the same heart rate and very different cardiac output if ventricular filling or ejection differs. Conversely, a faster heart may not raise output when stroke volume falls. A Zebrafish Blood Flow Analysis System makes that distinction practical by preserving both components of the equation. This is especially useful in pharmacology, toxicology, genetic studies, and early phenotype screens, where a treatment may alter rhythm, contractility, chamber geometry, or vascular flow through different mechanisms.
Quality checks that protect the quantification
Before treating a result as biological, inspect a small set of failure points. Confirm that the fish is oriented consistently and that the ventricle—not an overlapping atrial or outflow region—was traced. Check that the selected end-diastolic and end-systolic frames really correspond to the largest and smallest ventricular states. Exclude recordings with motion artifacts, poor focus, or unstable physiology according to predefined criteria.
Reviewing distributions, rather than only group averages, is useful too. A broad spread in flow rate or output can signal a real heterogeneous response, but it can also reveal inconsistent mounting, developmental staging, or image analysis settings. Most importantly, keep raw videos, analysis settings, and the version of the Zebrafish Blood Flow Analysis System used for each run. That audit trail turns a calculated number into a result another researcher can interrogate.
What makes a result interpretable
A strong cardiac-output result connects the equation to the biology. It states how stroke volume was derived, how heart rate was measured, how many beats and animals were included, and what conditions were held constant. It also distinguishes direct measurements from modeled estimates. Rather than claiming that one instrument alone proves cardiovascular efficacy or safety, the report should show whether volume, heart rate, and blood-flow observations agree with the proposed interpretation.
For teams building or refining a cardiovascular assay, a Zebrafish Blood Flow Analysis System is most useful when it makes these decisions transparent: which frames were analyzed, which assumptions produced volume, and which controls support the final comparison. Hunter Lab’s zebrafish cardiovascular application experience can be relevant when a team needs pre-purchase protocol discussion or training, but the study’s own validated workflow remains the basis for quantitative conclusions.
Conclusion
A Zebrafish Blood Flow Analysis System quantifies cardiac output by combining ventricular volume change with heart rate, then using flow observations as a complementary check on hemodynamics. The formula is simple; reliable quantification depends on consistent staging, preparation, imaging, segmentation, and review. When those elements are documented, cardiac output becomes a useful endpoint for comparing how a zebrafish heart and circulation respond across experimental conditions.








